Guide / August 27, 2026 / 6 min read
Market success metrics for a tech startup: the 2025 numbers
By Ozzy Gercek
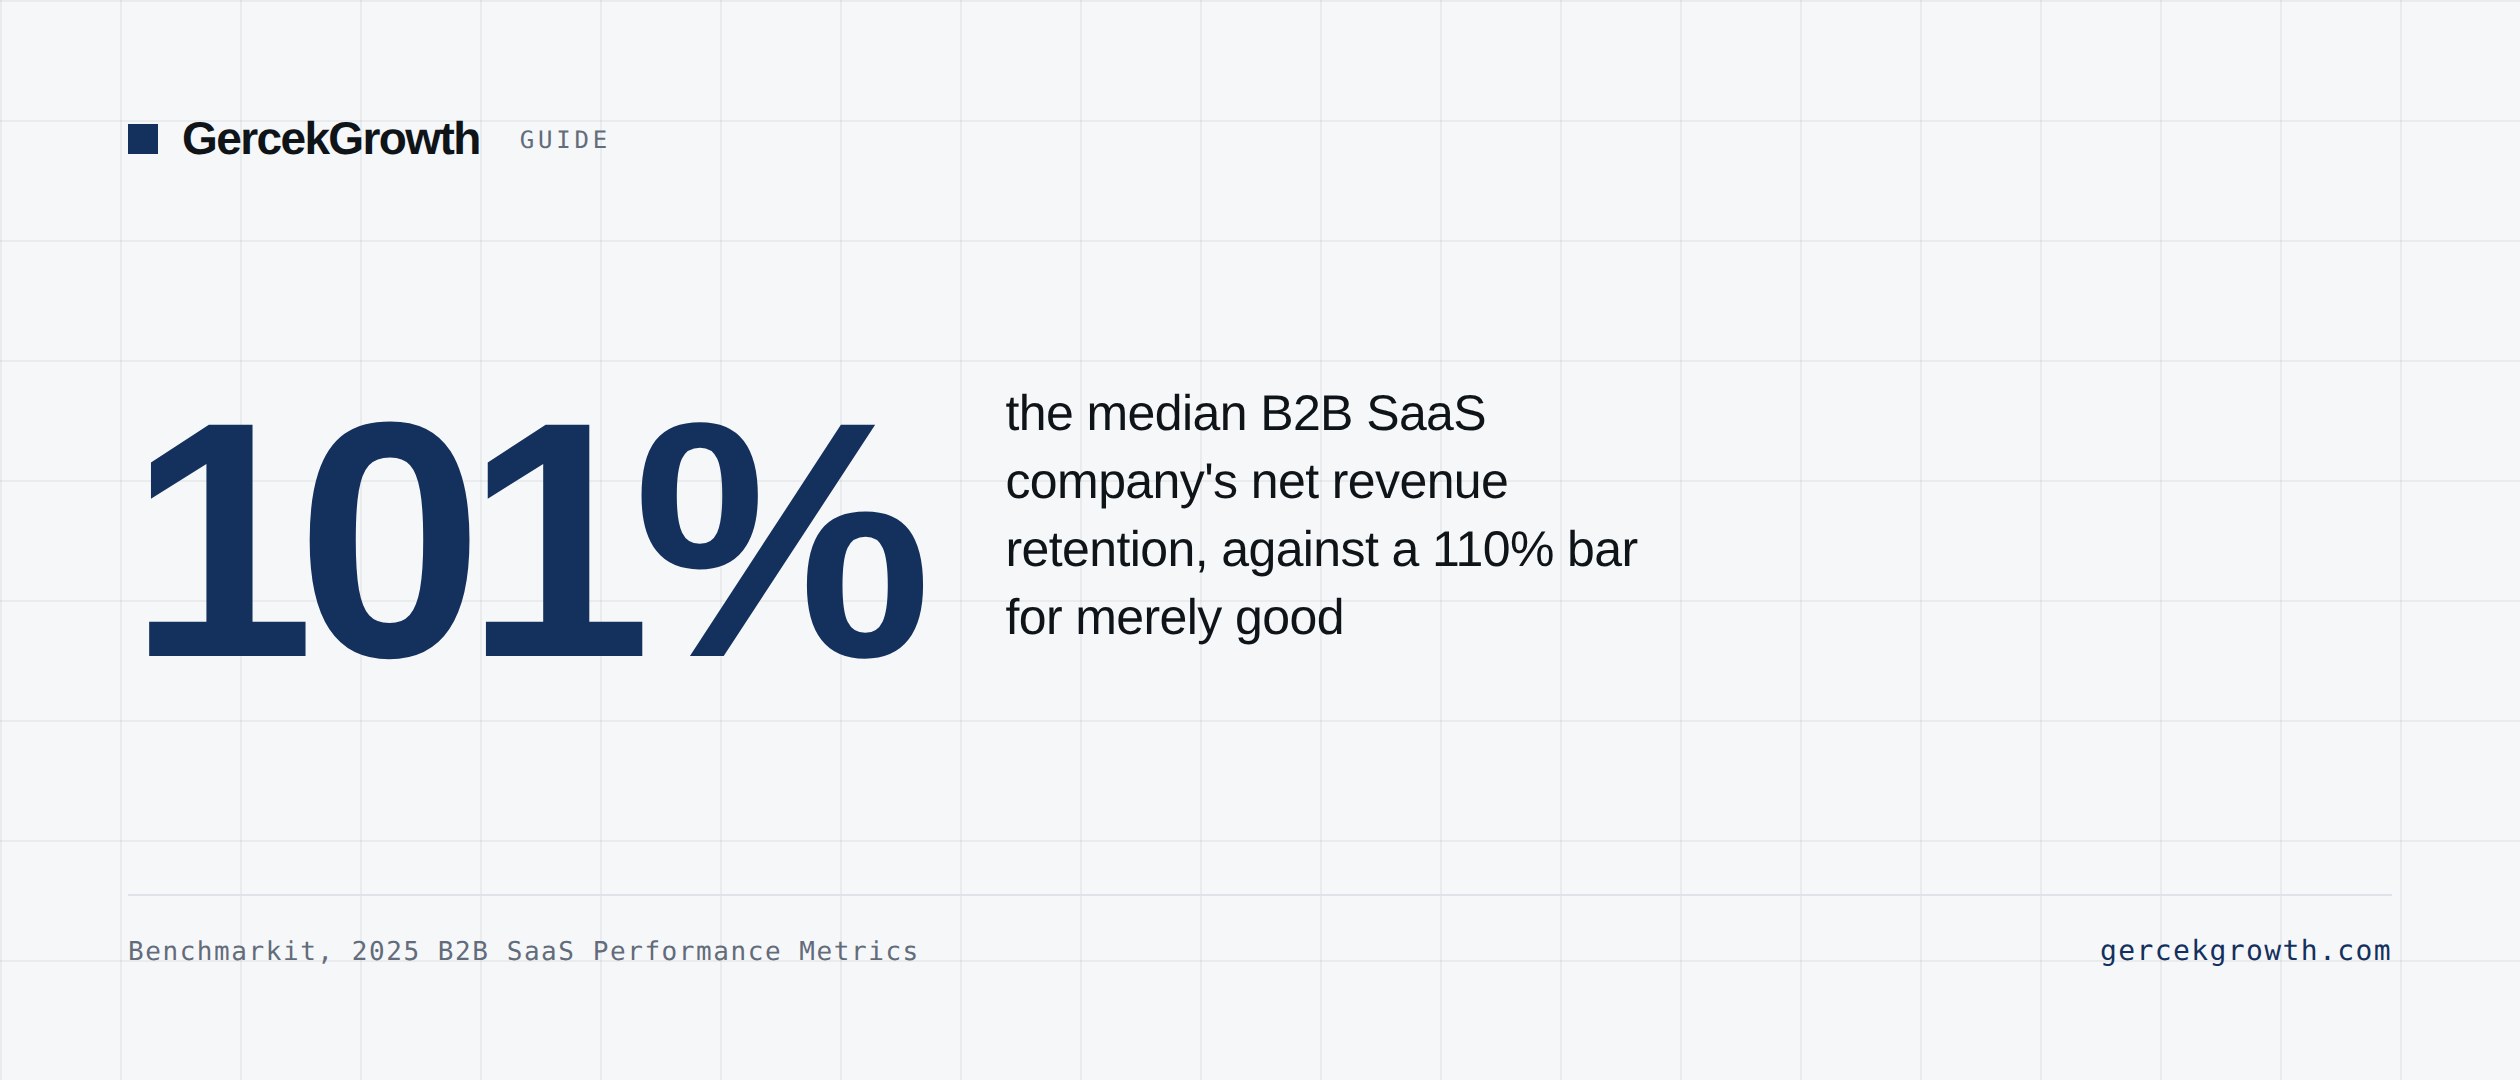
Short answer: The metric that tells you earliest whether you are winning in the market is not growth, it is retention. In the 2025 benchmarks the median B2B SaaS company has net revenue retention (NRR) of 101% and gross retention (GRR) of 88%. The average company loses 12% of its existing revenue every year and only just covers it with expansion from the customers who stay. The order is: retention first, then efficiency (CAC payback and burn multiple), then growth rate. Spending on growth while retention is broken is carrying water in a leaking bucket.
First, establish which band you are in
The most common mistake in reading benchmarks is comparing yourself to a median from a different size and category. In High Alpha's survey of 800+ private B2B software companies, run in August and September 2025, median annual growth splits by ARR band and by whether the company is AI-native:
- Under $1M ARR: B2B SaaS median 75%, AI-native median 100%. Top quartile 300%.
- $1M to $5M: B2B SaaS 40%, AI-native 110%.
- $5M to $20M: B2B SaaS 30%, AI-native 90%.
- $20M to $50M: B2B SaaS 35%, AI-native 60%.
- Above $50M: B2B SaaS 15%, AI-native 40%.
The gap is two to three times. Run an AI product and compare yourself to the classic B2B SaaS median and you will believe you are ahead. Do the reverse and you will panic without cause. Picking the right band and category comes before the metrics themselves.
Almost all of these benchmarks come from companies at $1M ARR and above. Below that, the medians below do not apply to you; the last section of this article covers what to measure instead.
1. Retention: the earliest and most honest signal
Benchmarkit's 2025 report puts median NRR at 101% and median GRR at 88%. GRR was 90% in 2022, so it is falling. Put the two side by side and the picture is this: the average company only just breaks even, covering lost revenue with expansion from the customers who remain.
On the widely used bands attributed to David Sacks, NDR of 110-120% is good, 120-130% is great, and above 130% is elite. A median of 101% sits in none of those. The lesson: do not mistake the median for a target. The median tells you where the average company is, not where a good one should be.
In the same report expansion revenue accounts for 40% of total new ARR, up five points in a year, rising to 58-67% for companies above $50M. As you scale, most new revenue comes from existing customers rather than new ones. Trying to build the growth engine before fixing retention is running the sequence backwards.
2. Efficiency: how fast you get the money back
Benchmarkit puts the 2024 median new-customer CAC ratio at $2.00, up 14% in a year. Blended CAC ratio is $1.61. The CAC ratio on expansion revenue is $1.00. Read plainly: you spend two dollars of sales and marketing for one dollar of new ARR, and the same dollar from an existing customer costs half as much.
CAC payback has lengthened by 12.5% at the median since 2022. In the same data, deals with ACV above $250,000 show materially shorter payback. A startup working with a small average deal size is under more efficiency pressure, not less.
Burn multiple, in Sacks's formulation, is net burn divided by net new ARR. The accepted bands by stage: 1.5-2.5 at pre-seed and seed, 1.0-1.5 at Series A, 0.5-1.0 at Series B and C, and 0-0.5 late stage. An investor who wants to read company health from a single number usually reads this one, because it combines growth and efficiency in one figure.
For context: at the median company sales and marketing is 37% of revenue, rising to 47% at VC-backed companies and falling to 33% at PE-backed ones. Gross margin is 77% overall, 81% on subscription and 30% on professional services.
3. Growth: necessary, not sufficient on its own
Benchmarkit's 2024 median growth is 26% and trending down; the same companies planned 35% for 2025. That gap between plan and outcome repeats every year, so do not treat your own plan as a benchmark.
The Rule of 40 is simple: growth percentage plus profitability percentage above 40. The stage-adjusted version is more useful. At seed and Series A, 30-40 is considered enough if NDR is above 110% and CAC payback is under 18 months; at Series B, 40-50; at Series C and beyond, the best sit at 50-60.
ARR per employee is another common efficiency measure. Benchmarkit reports $200,000 to $300,000 for companies in the $50M to $100M band; High Alpha's 2025 survey saw later-stage companies rise 42% to $350,000 and 50% to $400,000.
What to stop measuring
- Registered users and downloads. A user who does not pay is an interest signal, not a market signal. Confusing the two is the fastest way to shape the product around the wrong person.
- Pipeline with no conversion attached. "We built $3M of pipeline" says nothing without the historical close rate on that pipeline.
- MQL counts with no next-stage conversion. If you do not know the MQL to SQL rate, the MQL count measures how busy marketing is and nothing else.
- Email open rate. Since Apple's Mail Privacy Protection, open data is systematically inflated. Look at reply rate and meetings booked.
The correction if you sell from Türkiye into the US or EU
All the benchmarks above come predominantly from companies based in the US and Europe. If you sell into those markets, these are the numbers you compete against, so you should measure yourself against this table rather than against peers in Türkiye.
The capital side, though, is not the same. Startup Genome's GSER 2025 puts Istanbul's median seed round at $487,000 and median Series A at $2 million, well under the runway a comparable US company holds. The practical consequence: the binding metric for you is not growth rate, it is burn multiple and CAC payback. You have to show the same growth on less money, and if you are not measuring that, you find out when the money is gone. I set out the capital picture with its numbers in a separate article.
What to measure below $1M ARR
In this band the medians are useless to you because there is barely a sample. Three things are worth measuring instead, and all three can be tracked monthly:
- Cohort retention. Of the customers who arrived in January, how many are still there at month three, month six, month twelve. A single blended churn number hides whether you are improving.
- Time to first value. How many days after signing does a customer get the first real benefit from your product. As that stretches, month-six retention falls.
- Whether the channel repeats. If the first ten customers came from people you personally know, that is not a channel. A channel proves itself by revenue falling when you switch it off.
To see how many leads and emails those numbers require in a target market, the pipeline calculator works backwards from a revenue goal. To find which part of the system is leaking when the metrics are off, that is what the Outbound Audit takes apart.
Sources
- 2025 SaaS Benchmarks ReportHigh Alpha × Growth Unhinged, 800+ özel B2B yazılım şirketi, Ağustos-Eylül 2025
- 2025 B2B SaaS Performance Metrics BenchmarksBenchmarkit, ağırlıklı olarak 2024 verisi
- David Sacks Playbook for SaaS Founders: Burn Multiple, Rule of 40, and NDRCapitaly, 2025
- 2025 SaaS Benchmarks Report (tam rapor, PDF)High Alpha
- Istanbul Rising: How Türkiye Became a Global Leader Among Emerging EcosystemsStartup Genome, Global Startup Ecosystem Report 2025
Every figure above is linked to its primary source and dated. Where a number is asserted by a source rather than measured, the text says so. If you find something out of date, tell me and I will correct it.